


Market Review July 2026
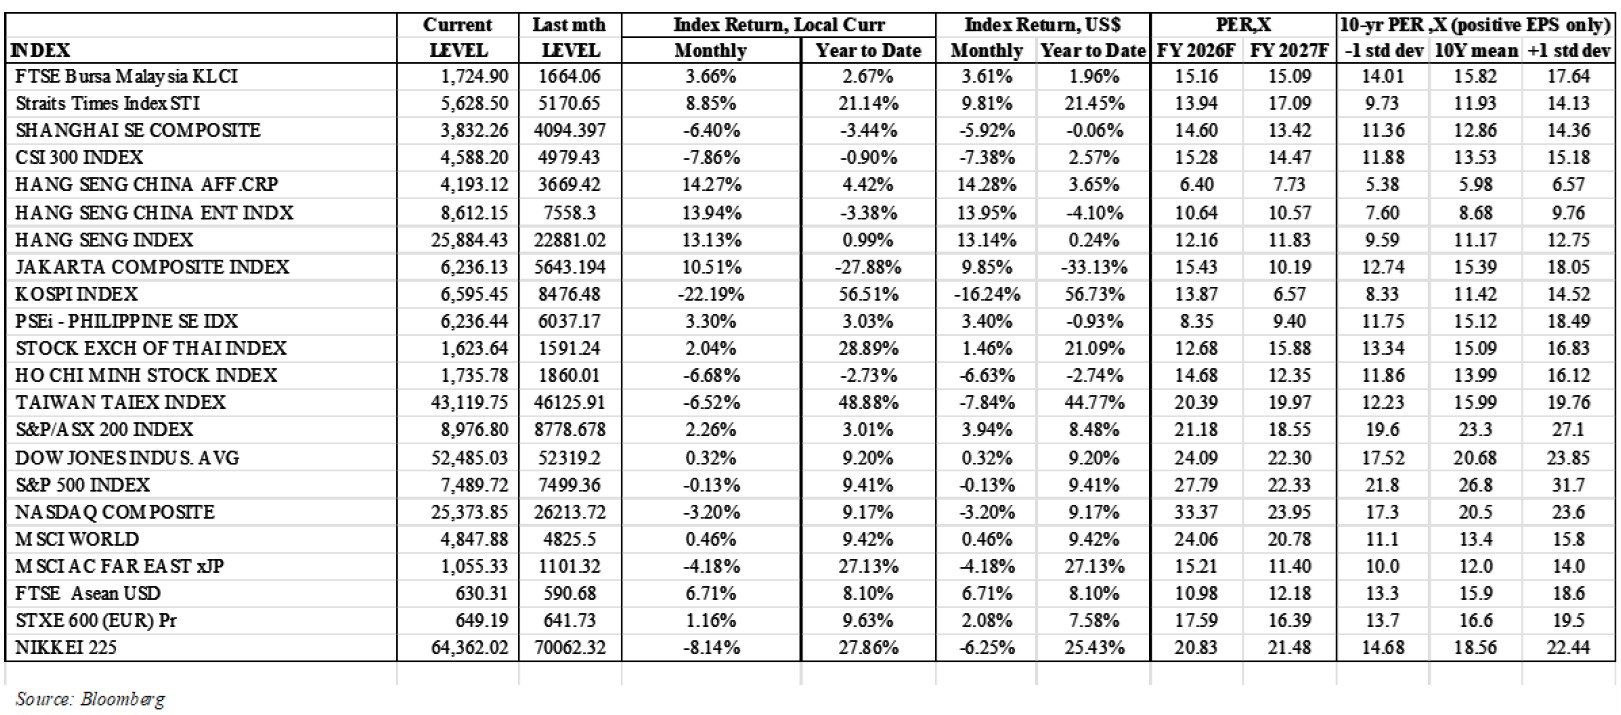 Global equity markets experienced heightened volatility in July 2026, led by a sharp correction in AI-related stocks. Major AI-exposed indices, including the PHLX Semiconductor Index, South Korea’s KOSPI, China’s ChiNext Index, and the STAR50 Index, declined between 21% and 29% during the month as investors took profit following the sector’s strong rally. The correction reflected growing concerns over stretched valuations, crowded positioning, and the sustainability of elevated AI-related capital expenditure. Intensifying competition within the AI industry further weighed on sentiment after Chinese AI company Moonshot AI introduced its Kimi K3 model, which offers performance comparable to leading models from OpenAI and Anthropic at a substantially lower cost. Meanwhile, renewed geopolitical tensions between the United States and Iran pushed oil prices higher, renewing concerns over inflation and the prospect of interest rates remaining elevated for longer. The World Index gained 0.46% in July, while the MSCI Far East Ex. Japan index retraced 4.18%. Within the Asia region, ASEAN equities gained 6.71%. The best performing indices were Hang Seng China-Affiliated Corporations Index (+14.27%) and Hang Seng China Enterprises Index (+13.94%) markets. Regional currencies mostly strengthened against the USD. The best performing currencies were Korean Won (+7.60%) and Japanese Yen (+3.27%), while the weaker ones were New Taiwan Dollar (-1.42%) and Indian Rupee (-0.77%).
For the month, Dow Jones Industrial Average (DJIA) edged up 0.32%, while S&P 500 Index and Nasdaq Composite declined 0.13% and 3.20% respectively. U.S. equity markets declined as investor sentiment weakened following a broad-based sell-off in semiconductor stocks on growing concerns over whether elevated AI-related capital expenditure can continue to deliver sufficient earnings growth to justify current valuations. At the same time, expectations that interest rates may remain higher for longer weighed on high-growth technology stocks. US inflation showed clear signs of cooling in June, with the headline Personal Consumption Expenditures (PCE) price index easing to +3.7% YoY (down from +4.1% YoY in May). Meanwhile, the core PCE price index, the Fed’s preferred gauge of inflation, rose by 3.3% YoY in June (May: +3.4% YoY). In addition, according to the Bureau of Economic Analysis’ advance estimate, US GDP growth slowed to an annualized +1.5% QoQ in 2Q26 (below the +2.1% QoQ expected by the market consensus), dragged down by a slower export growth (dropping to a 4.5% annualized gain compared to a 10.9% increase in the first quarter) and strong imports increasing at an annualized rate of 11.5% in the 2Q26 compared to 11.8% in 1Q26. While softer June PCE data validates the Fed’s decision to hold rates at 3.50–3.75% at the recent FOMC meeting, annual headline PCE (+3.7% YoY) and core PCE (+3.3% YoY) inflation remain well above the Fed’s +2.0% target.
The STOXX Europe 600 Index gained 1.16% in July, extending its advance of 0.25% in June, supported by resilient corporate earnings and improving investor sentiment despite a softer macroeconomic backdrop and ongoing uncertainty over the interest rate outlook. Meanwhile, Eurozone inflation continued to moderate in June 2026, with headline inflation rising to 2.9% YoY from 2.8% in the previous month, driven primarily by increases in energy (10.0%, compared with 8.5% in June), followed by services (3.3%, compared with 3.2% in June), food, alcohol & tobacco (1.2%, compared with 1.5% in June) and non-energy industrial goods (0.9%, compared with 0.7% in June). Core inflation, which excludes volatile food and energy prices, also rose to 2.5% YoY from 2.4% in the previous month. Inflation in the eurozone remained well above the European Central Bank’s (ECB) 2.0% target, reinforcing market expectations that the ECB could raise its key policy rate by a further 25 basis points at its September meeting.
Hang Seng Index and Hang Seng China Enterprises Index recovered to gain 13.13% and 13.94% respectively, following the 9.21% and 10.36% falls in June. Hong Kong market outperformed regional peers amid heightened global market volatility as capital rotated from AI-related stocks into underperforming markets and sectors trading at more attractive valuations. Meanwhile, China’s economic growth moderated in 2Q26, with real GDP expanding 4.3% YoY, down from 5.0% in 1Q26, reflecting an uneven recovery driven by widening divergence between AI-related industries and traditional sectors. Although nominal GDP growth accelerated to 5.892% in June from 4.938% in March, its strongest pace in nearly three years, indicating a gradual easing in deflationary pressures, broader economic momentum remained weak. Official data showed the Composite PMI falling from 50.6 in June to 49.3 in July. The manufacturing PMI fell to 49.2 in July from 50.2 in June, hitting a five-month low, while the non-manufacturing PMI declined to 49.0 from 50.2, signaling a renewed slowdown after two months of modest expansion. The decline signals renewed concerns over a slowdown in China’s economy. The weakness was partly attributable to seasonal factors and disruptions caused by extreme weather conditions. Nevertheless, with the General PMI falling to its lowest level since late 2022, additional policy support may be required to sustain domestic demand and support broader economic activity.
South Korea’s KOSPI Index declined a further 22.19% in July. Concerns overcrowded positioning in AI-related stocks triggered a broad selloff across global technology markets, weighing heavily on South Korean equities, given the market’s significant exposure to semiconductor and AI-related companies. On 31 July, the KOSPI erased early gains to close 1.2% lower as investors took profit in AI and semiconductor stocks. Selling pressure on index heavyweights such as Samsung Electronics and SK Hynix reflected growing concerns about rising stock valuations and leveraging in the market, uncertainty over the sustainability of AI-related spending, and expectations of higher global interest rates for longer. Market volatility was further amplified by the unwinding of leveraged retail positions, with Goldman Sachs estimating that more than 1.2 million retail trading accounts received margin calls, of which approximately 320,000–360,000 were fully liquidated, exacerbating selling pressure across the market. Meanwhile, the Bank of Korea raised its policy rate by 25 basis points to 2.75% after June consumer inflation rose to 3.2% YoY from 3.1% YoY in May, while core inflation remained elevated at 2.5%. Despite the weakness in equity markets, South Korea’s external sector remained resilient, with July exports driven by robust technology demand. Semiconductor exports surged 178.8% YoY, while computer-related product shipments jumped 404.0% YoY, highlighting continued strength in AI-driven demand despite ongoing weakness in selected manufacturing industries.
Taiwan’s TWSE Index declined 6.52% in July, reversing the 1.54% gain recorded in June, as a broad selloff in global technology stocks weighed on investor sentiment. Despite weaker sentiment across the global technology sector, Taiwan’s equity market remained resilient, supported by the country’s strong macroeconomic fundamentals and continued strength in its technology supply chain. Taiwan’s economy remained robust, with 2Q26 GDP expanding 12.92% YoY, marking the third consecutive quarter of double-digit growth. On a seasonally adjusted basis, QoQ GDP growth accelerated to 2.39% from 1.69% in 1Q26, extending the economy’s expansion streak to 13 consecutive quarters. Although investors rotated out of high-flying AI and semiconductor stocks amid profit-taking, robust export demand helped underpin market sentiment. ICT export orders surged 67.2% YoY to USD32.4 billion, driven by strong cloud-related demand for AI servers and networking equipment, while electronics orders rose 61.2% YoY to USD37.2 billion, supported by resilient demand across semiconductor manufacturing, chip distribution, and memory products. The sustained momentum in Taiwan’s technology exports, together with improving earnings visibility for leading semiconductor companies, continued to support the broader market despite weakness in selected technology names.
Singapore’s STI surged 8.85% in July supported by continued strength in the manufacturing sector and resilient export performance, particularly in electronics and AI-related industries. Singapore’s economy advanced 5.7% YoY in 2Q2026, slowing from an upwardly revised 6.3% expansion in Q1, which was the strongest annual growth since Q3 2024, but remaining above estimates of 5.5%, according to preliminary estimates. Goods producing sectors grew from 8.4% YoY in 1Q2026 to 10.4% YoY in 2Q2026, with manufacturing output surging 12.2% YoY in 2Q26, accelerating from 5.0% YoY in the previous quarter due to strong AI-related demand. While growth in Singapore’s Construction sector grew 11.8% YoY in Q1 followed by an estimated 6.2% growth in Q2. Quarterly, Singapore’s GDP grew by 5.7% YoY with 1.1% QoQ expansion, marking the softest growth since Q1 2025. Singapore’s external sector remained resilient, supported by robust exports sectors. Non-oil domestic exports (NODX) grew 20.7% YoY in June 2026, moderating from the revised 38.4% increase in May, which was the strongest growth since December 2003. Nevertheless, this marked the tenth consecutive month of export expansion, driven by continued strength in electronics exports, which surged 105.1% YoY following a 94.8% increase in May. Growth was underpinned by robust AI-related demand, with exports of disk media products, integrated circuits (ICs), and personal computers rising 170.9%, 115.4%, and 95.8% YoY, respectively. The broad-based improvement reinforces the positive outlook for Singapore’s manufacturing and technology sectors. These trends may support Singapore’s projected GDP growth, although actual outcomes may differ.
Malaysia’s KLCI advanced 3.66% in July on the back of improving investor sentiment. Malaysia’s Leading Index declined 0.5% MoM, marking its first monthly contraction in three months and the sharpest decline since January 2026. The Index recorded a 1.1% MoM increase in April. Annual growth in the Leading Index moderated to 0.8% YoY from 1.3% YoY in the previous month, signaling a moderation in the pace of economic expansion. Malaysia’s Producer Price Index (PPI) for local production accelerated to 9.2% YoY in June 2026 from 7.8% in May, marking the highest annual increase recorded so far this year and indicating continued upward cost pressures across the production sector. Based on the advance estimate, Malaysia’s GDP grew stronger than expected at +5.8% YoY in 2Q26, accelerating from +5.4% YoY in 1Q26. Growth picked up across most major sectors like refined petroleum, electronic and optical sectors, except for the agriculture industry, which contracted by 3.7% YoY in 2Q26, reversing from 2.6% YoY growth in 1Q26. Growth in the services sector eased marginally. Malaysia’s total trade maintained double-digit expansion in June 2026, growing faster by 44.7% YoY as compared to 29.8% YoY in the prior month and expanding for the 10th straight month. Export growth accelerated to 45.3% YoY (May 2026: +44.7% YoY), the fastest growth since Aug-22. Import growth also accelerated sharply from 14.1% in May to +43.9% YoY in June, the fastest growth since Feb-22.
Thailand’s SET Index gained 2.04% in July, reversing its 0.85% decline in June, largely supported by increased investment inflow, stronger goods exports, higher government spending, and resilient private consumption. However, the improvement does not yet signal a fundamental shift in the economy’s growth trajectory. Thailand’s economic momentum remained uneven. Exports grew 20.8% YoY to USD34.7 billion in June 2026, accelerating from 10.6% YoY in May and marking the 24th consecutive month of expansion. Growth continued to be driven by robust global demand for technology products and AI-related applications. Nevertheless, export growth slowed significantly from April’s 23.1% YoY increase, largely due to softer shipments to China. Meanwhile, imports surged 50.3% YoY to USD41.19 billion in June 2026, accelerating from 35.1% YoY in May, driven by stronger domestic demand, policy stimulus, and higher imports of fuel, raw materials, and capital goods. Thailand’s industrial production contracted 3.1% YoY in June 2026, marking the third consecutive month of decline, weighed by weaker output in automobiles (-12.6%), petroleum products (-8.0%), apparel (-9.0%), and palm oil (-33.2%). However, resilient electronics demand provided partial support. Despite a 0.4% contraction in 1H26, the Industry Ministry maintained its 2026 growth forecast of 1%–2%.
The Jakarta Composite Index gained 10.51% in July. The market staged a recovery from the oversold situation in recent months, supported by improving domestic demand and external sector resilience. Indonesia recorded a trade deficit of USD450 million in June down from USD1.61 billion in the previous month. June export totaled USD25.46 billion, up 8.84% YoY, driven by stronger shipments of nickel products and palm oil. Meanwhile, import surged 34.27% YoY to USD25.91 billion due to heavy demand and higher oil prices. Despite the back-to-back deficits in May and June, Indonesia maintained a cumulative trade surplus of USD3.58 billion for the first half (January–June) of 2026. The oil and gas trade deficit widened significantly to USD3.76 billion from USD1.53 billion in May 2025, while the non-oil and gas surplus narrowed to USD2.15 billion from USD5.83 billion in the previous month. Indonesia’s weaker trade balance reflected the combined effects of rupiah depreciation and elevated global oil prices, which increased import and transportation costs. Geopolitical tensions in the Middle East further intensified energy price pressures, highlighting the economy’s vulnerability to external shocks and creating near-term risks to its external balance. To safeguard macroeconomic stability, Bank Indonesia responded by raising its benchmark policy rate by a cumulative 50 basis points to 5.75% through two consecutive 25-basis-point hikes. The tighter monetary stance is intended to support the rupiah, anchor inflation expectations, preserve financial market stability, and strengthen confidence amid an increasingly uncertain global environment.
The Philippines PSE Index advanced a further 3.30%. The Producer Price Index (PPI) for manufacturing rose 3.0% YoY in June 2026, easing slightly from 3.1% in May. On a monthly basis, manufacturing producer prices increased 0.2%, while PPI averaged 2.3% YoY in 1H26, indicating that cost pressures for manufacturers remained manageable. The Philippines’ trade deficit widened to USD4.9 billion in June 2026 from USD4.4 billion a year earlier. Exports increased 24.1% YoY to USD8.8 billion, while imports rose 19.6% YoY to USD13.7 billion. On a cumulative basis, the trade deficit reached USD30.8 billion in 1H2026, reflecting the country’s continued reliance on imports and persistent external imbalances despite resilient trade activity and robust export growth. Investor sentiment improved after June inflation came in below market expectations at 6.4% YoY (consensus: 6.5%), reinforcing expectations of a more supportive macroeconomic environment. Nevertheless, ongoing geopolitical tensions in the Middle East and domestic political uncertainty continued to limit gains and cap overall market upside. On the banking front, the gross non-performing loan (NPL) ratio of Philippine banks declined to a six-month low of 3.29% in June, from 3.44% in May, indicating an improvement in asset quality.
Philippine banks’ gross non-performing loans (NPL) reached PHP584.94 billion in June, a decline from PHP604.41 billion in May. Meanwhile, BSP data showed that the industry’s total outstanding loan portfolio reached PHP14.88 trillion in June, marking a 9.8% increase.
Vietnam’s VN-Index declined 6.68% in July, extending its 0.16% decline in June. Vietnam’s trade deficit widened to USD3.587 billion in July from USD2.64 billion in June, as import growth continued to outpace exports. Goods exports increased 25.0% YoY to USD53.0 billion, while imports surged 41.0% YoY to USD56.67 billion, reflecting strong demand for raw materials and capital goods. For the first seven months of 2026, exports rose 21.7% YoY to USD320 billion, while imports climbed 34.8% to USD340 billion, resulting in a cumulative trade deficit of USD20.5 billion, surpassing Vietnam’s previous full-year record deficit of approximately USD18 billion in 2008. Meanwhile, consumer price inflation moderated to 4.45% YoY in July from 4.69% in June, suggesting easing inflationary pressures despite resilient domestic demand. Industrial production remained robust, with output rising 14.5% YoY, accelerating from 12.7% YoY in June. Growth was driven by a 15.0% YoY increase in manufacturing output and a 12.5% YoY rise in electricity production and distribution, reflecting sustained global AI-driven demand, resilient export-oriented manufacturing activity, and continued supply chain diversification despite geopolitical uncertainties and elevated energy costs.
The shift to a dovish monetary stance in the US at the start of 2026 had been upended by the war in the Middle East which disrupted the flow of oil exports and pushed up oil prices and brought about consequential price increases. After an almost 12 months of twist and turns in the US tariff saga, the market is still divided on impact of higher tariffs on macro variables such as inflation and economic activities. US market valuations are at historical high, and the high valuation is further driven by massive capital expenditure for AI. Meanwhile, the semiconductor and AI investment cycle may be entering a more challenging phase following a broad correction across global technology markets. Investors locked in gains following the sector’s extended AI-driven rally amid concerns over stretched valuations, crowded positioning, and doubts over elevated AI-related capital expenditure will generate sufficient returns to justify current market expectations. Expectations that global interest rates may remain higher for longer further weighed on high-growth technology stocks.
Geo-political developments as well as policy directions in the major economies, in particular US and in China, remain on our radar screen. The market is still watchful of developments in Trump’s tariffs for the key trade partners. The US tariffs scene has been marked by changes, the latest development being the US announcement in June of imposition of tariffs ranging from 10% to 12.5% on various countries depending on the countries’ compliance with forced labour ban. Meanwhile, the military conflict between the US/Israel and Iran has entered a new phase with a semblance of ceasefire following the signing of the US-Iran MOU, but uncertainty remains as to whether this will lead to a full peace in the region. However, it has so far resulted in a substantial fall in the price of crude oil. Global stock markets have also rallied on expectation of decline in energy costs. However, uncertainty remains with instances of military strikes and counter strikes taking place. The road to conclusion of a peace agreement between the US and Iran will not be smooth, with difficulties over several issues, including Iran’s nuclear programme, the lifting of US sanctions and the Hezbollah factor.
In Asia, the focus is on the pace of China’s economic recovery which has been weaker than expected. The tariff issues with the US and continuing efforts to broaden restrictions on sales of tech equipment and services to Chinese entities can only exacerbate the economic situation in China, while presenting frictions to the US-China relationship. The Chinese property sector continues to face challenges, and any sign of stabilization and growth will have positive catalyst for China’s economy and risk assets. The Chinese government continues to bring forth measures to help the economy. The Chinese government remains constructive on policies to spur economic activities to achieve economic growth target. Priorities in terms of business sectors that would receive policy support could be expected to vary over time. The various measures are positive for market sentiments. However, the longer- term effectiveness on China’s economy continues to be closely watched. It may take time for the initiatives to bear fruit. The focus will be on addressing the challenges in the property market, lifting consumer sentiments and consumption, countering the effects of restrictive measures imposed by the US, and promoting the industries that would spearhead the country’s advances in key sectors.
On external trade, countries with high export dependency for growth in the Asia region including ASEAN will face significant challenges arising from the US tariff policies. The disruption in supply chain realignment may result in temporary mismatch in corporate earnings delivery against market expectation during the initial stage of tariff implementation. To date, while ASEAN countries’ exports to the US have been impacted by the tariffs, these countries have been able to mitigate the impact on the economic growth through trade diversifications. Many of these countries have now to also contend with having to manage disruptions in energy supplies and the ensuing price escalations.
While at least one interest rate cut is expected by the end of 2026, the outlook for risk assets continues to face several headwinds. These include the lagged effects of still-elevated interest rates on business activity and economic growth, uncertainty surrounding U.S. policy, sustainability of the historically high U.S. equity valuations, persistent geopolitical tensions, and their impact on global energy supplies, as well as slower-than-expected economic growth in China. Nevertheless, we remain cautiously optimistic about the investment opportunities within the investment space we are in. Despite the recent recovery, Chinese equities remain under-owned after several years of sustained market weakness, and current valuations are below selected historical averages based on internal analysis. Coupled with the Chinese government’s recent policy support measures, these factors provide scope for further upside over the medium term.
We continue to apply our strategy of focusing on identifying fundamentally healthy companies with low valuations, low leverage, high growth, robust management and a strong track record, and adherence to our investment philosophy of “Never Fully Invest at All Times” which has served us well over the years.
We thank you once again for your continued faith in us and hope to remain good stewards in our endeavour to protect and grow your capital.